
Create Test Scores Overview Reports
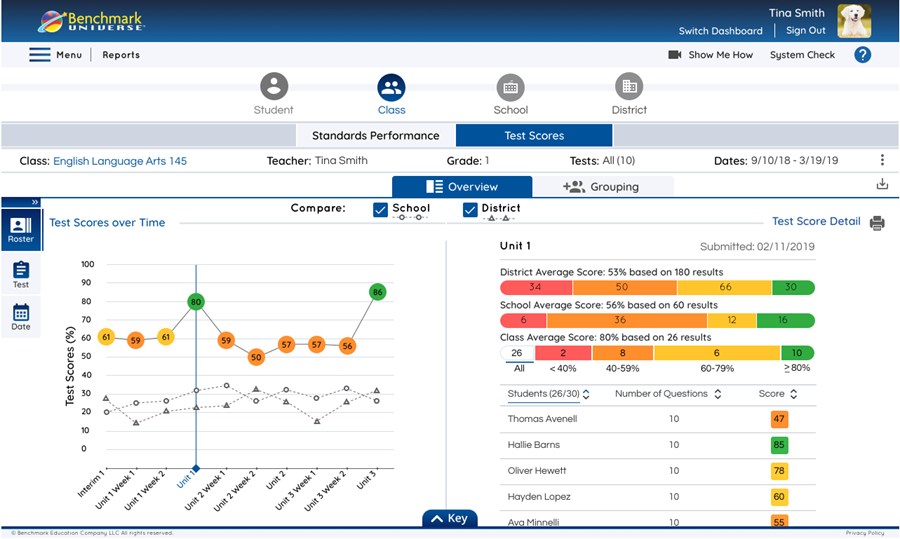
Benchmark Reports help teachers better understand how their students are performing on tests over the course of the year. The Test Scores Over Time graphs allow you to see how individual students and entire classes are performing on each test given. Using these graphs it’s easy to identify trends and issues that can help inform your instruction and improve the outcomes for your students.
You can begin by making a selection in the table on the left.
Click image to expand.

|
Why do overall average test scores sometimes differ for Standards Performance reports and Test Scores reports for the same assessment?
Standards Performance reports add up the points earned for each standard tagged to a question and in some cases a question may have multiple standards associated with it. Test Scores reports look only at the points earned for each question on the assessment. Because of this, an assessment can have a slightly different overall average test score based on whether you are looking at a Standards Performance-based vs a Test Scores-based report. |
View Student Test Scores Over Time
You can view an individual student’s test score history by using the Universal Selector.
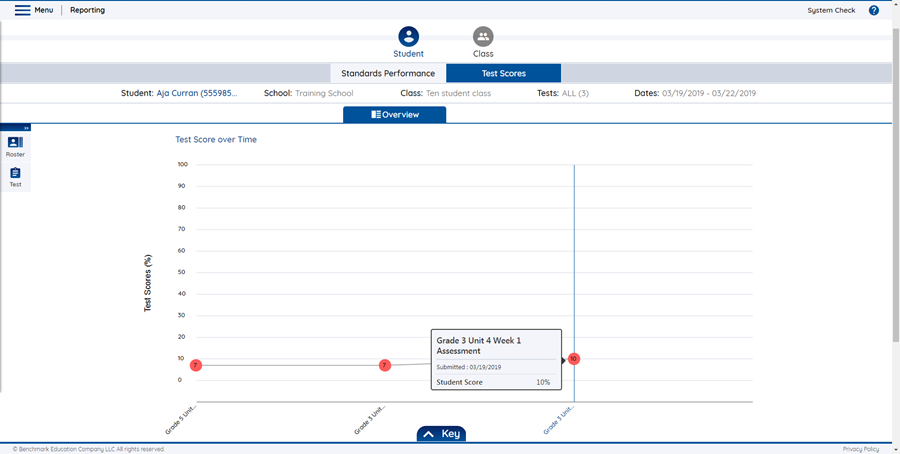
- Click Test Scores on the Report Type Selector tab.
- Use the Universal Selector to select a student from the Roster tab and click Apply.
- Select a test (or multiple tests) from the Test tab and click Apply.
- View the Test Scores Over Time graph.
- Click a score circle to see the date when the assessment was submitted as well as the student’s score.
|
|
You can easily move between different levels of reports by clicking on the Student and Class icons (Report Level Selector) along the top of the page. |
View Class Test Scores Over Time
You can view the test performance history of an entire class by using the Universal Selector.
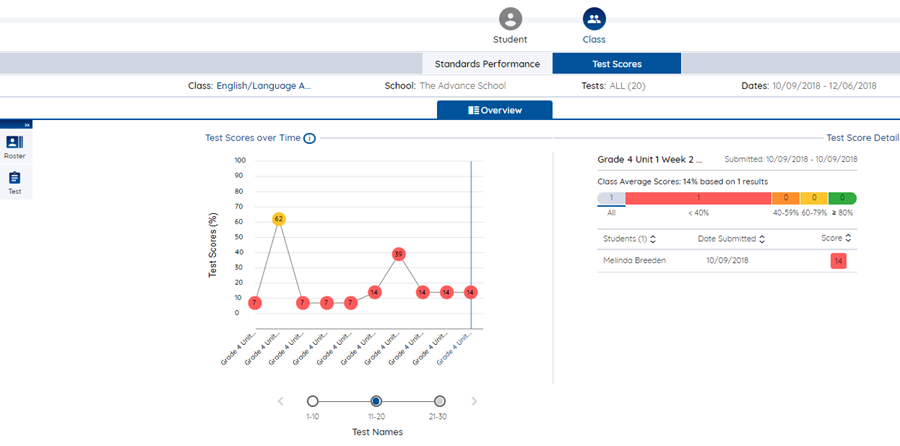
- Click Test Scores on the Report Type Selector.
- Use the Universal Selector to select a class from the Roster tab and click Apply.
- Select a test (or multiple tests) from the Test tab and click Apply.
- Click on a test score in the graph to see more detail about that test in the Test Score Detail area on the right.

|
Use the buttons below the Test Scores Over Time graph to navigate between the beginning and the end of the graph if there are too many tests to fit on the graph at the same time. |
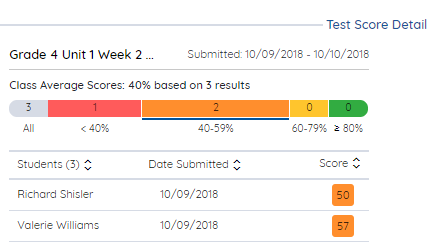
View Class Test Score Details
Similar to the Student List that appears with the Standards Overview Table, The Test Score Detail allows teachers to see the score for each student in their class for the test selected from the Test Scores Over Time graph on the left. Use the bar above the list to filter by achievement level and use the arrows next to the column names to further sort the list. The Test Score Detail is only available for reports at the class level.
- Choose the Class icon from the Report Level Selector at the top of the page.
- Choose Test Scores on the Report Type Selector tab.
- Use the Universal Selector to select a class from the Roster tab and click Apply.
- Select a test (or multiple tests) from the Test tab and click Apply.
- Select a test from the Test Scores Over Time graph on the left-hand side of the page.
- View the Test Scores Detail list on the right-hand side.
- Click on the bar above the list of students to filter the list by achievement level.
|
|
Click on the name of a student to see a more detailed report on that student. |
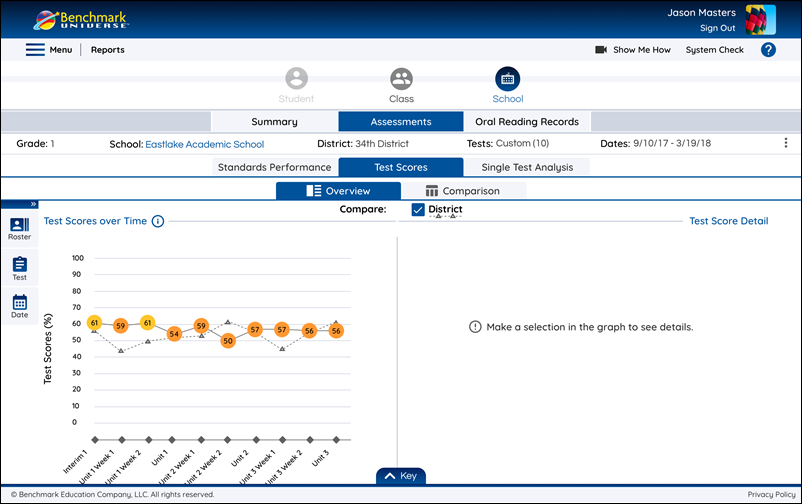
Compare Class Test Scores Over Time
You can compare the test scores of a class to the average performance of their school and district.
- Click Test Scores on the Report Type Selector.
- Use the Universal Selector to select a class from the Roster tab and click Apply.
- Select a test (or multiple tests) from the Test tab and click Apply.
- Click on the School or District buttons to generate comparison graphs for your current report.
|
|
You can also compare the performance of an individual student to the average performance their class, school, and district by using the Student tab in the Reports Level Selector and clicking the class, school, and district buttons above the generated graph. |
Print or Download Test Results
Teachers can print their currently selected test score result data by using the Print icon.

Teachers can also use the csv. button to the right of the Report Detail Indicator to download a spreadsheet of the test score results information of their entire class (in csv. format).
|
|
The csv. file contains the entire test performance history of a class. |
See Create Standards Overview Reports for more information.